
Compare Business Intelligence / Analytics Platforms Providers UK (2026)
Compare Data Connections, Models, Dashboards, Governance, AI And Adoption
Compare business intelligence software for UK organisations by data connections, preparation, semantic models, KPI definitions, dashboards, self-service analysis, scheduled reporting, embedded analytics, AI-assisted querying, security, deployment, support and total cost. Evaluate platforms against the same data, user and governance requirements before replacing spreadsheets, duplicated reports or department-specific reporting tools.
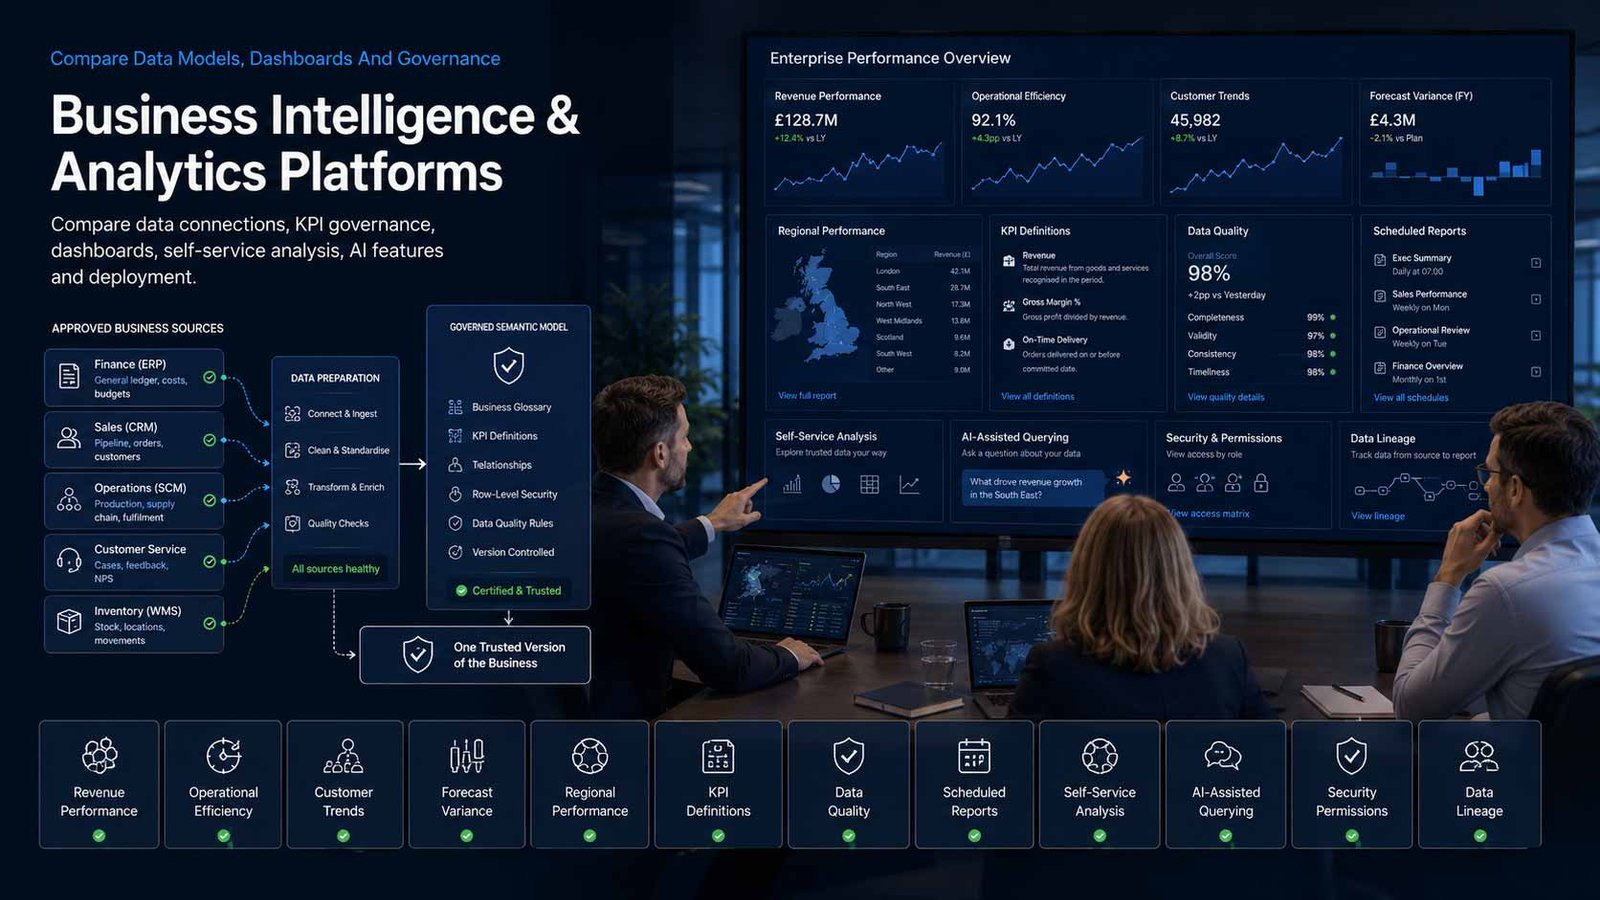
A Dashboard Is Only As Reliable As Its Definitions
Business intelligence can make performance visible, but inconsistent source data and unowned KPIs can create faster disagreement rather than better decisions.
- Define business questions, decisions and KPI owners before choosing charts
- Separate source extraction, transformation, semantic modelling and presentation
- Apply one governed definition to every report that uses the same measure
- Measure data freshness, adoption, query performance and decision impact
Business intelligence software connects, prepares, models and presents data so users can monitor performance, explore causes and make repeatable decisions. Modern platforms may provide dashboards, reports, alerts, natural-language questions, mobile views, embedded analytics, scheduled distribution, data preparation and a governed semantic layer that defines business measures consistently.
The correct platform depends on the existing data architecture and users. A Microsoft 365 business may favour Power BI and Fabric integration. A product company may prioritise embedded analytics. An organisation with several warehouses and complex metrics may need a strong semantic model. A smaller business may value rapid cloud connectors, transparent pricing and minimal administration.
This page does not compare accounting-only or CRM-only products. Accounting platforms can provide finance reports and CRM products can report sales activity, but those reports remain tied to one operational system. The comparison here focuses on cross-system business intelligence, governed metrics, analytical exploration and organisation-wide reporting.
Match The Platform To The Decisions And Users
Operational dashboards, board reporting, self-service analysis and embedded analytics have different data, governance and commercial requirements.
| Analytics Model | What It Usually Provides | Best-Fit Question |
|---|---|---|
| Operational dashboards | Tracks current or near-current service, sales, delivery, stock, support or production performance | Which decisions will users make from the dashboard, and how fresh must the underlying data be? |
| Management reporting | Produces governed periodic packs, KPIs, commentary and variance analysis for managers or boards | Can the platform preserve definitions, period comparisons, approval and distribution without rebuilding reports in spreadsheets? |
| Self-service analytics | Allows authorised business users to explore governed data, create reports and answer follow-up questions | How will the organisation prevent duplicated measures, unrestricted data access and unsupported personal dashboards? |
| Enterprise BI | Coordinates data models, security, certified content, multiple departments, environments and large user populations | Can the platform scale governance, deployment, capacity and administration without creating a central reporting bottleneck? |
| Embedded analytics | Places dashboards, metrics or interactive analysis inside a customer, employee or partner application | Which licensing, authentication, tenancy, branding, performance and development controls apply to external users? |
| Search and conversational analytics | Lets users ask questions in natural language against governed data and receive visual or narrative answers | Does the experience use an approved semantic model, show sources and preserve row-level permissions? |
| Mobile and alert-driven analytics | Delivers selected metrics, thresholds and actions to users without requiring full report exploration | Which alerts are actionable, who owns them and how will excessive or contradictory notifications be prevented? |
| Analytics as a managed service | A partner designs data pipelines, models, dashboards, governance and platform operations under an agreed service | Who owns definitions, source logic, models, code, licences, documentation and the ability to transfer the service? |
Eight Areas That Determine Business Intelligence Platform Fit
Use the same data and governance criteria for every provider so visual design and AI demonstrations do not hide modelling, security or capacity limitations.
Comparison Criterion
Data Sources, Connectors And Refresh
Compare databases, warehouses, spreadsheets, cloud applications, files, APIs, streaming data, on-premises gateways and direct-query options. Confirm authentication, extraction, incremental refresh, scheduling, latency, rate limits, failure handling and the impact on operational source systems.
Comparison Criterion
Data Preparation And Quality
Assess transformations, joins, cleansing, type handling, deduplication, validation, lineage, reusable dataflows and issue reporting. The platform should make quality rules visible and repeatable rather than hiding manual corrections inside one analyst’s workbook.
Comparison Criterion
Semantic Models And KPI Governance
Review measures, dimensions, hierarchies, relationships, calendars, calculation languages, reusable metrics, certified datasets, naming, documentation and ownership. A governed semantic layer reduces contradictory definitions without preventing authorised exploration.
Comparison Criterion
Visualisation, Reports And Distribution
Compare charts, tables, maps, drill-through, filters, subscriptions, exports, PDF or presentation delivery, mobile layouts, accessibility, commentary and alerts. The interface should support the decision rather than displaying every available visual.
Comparison Criterion
Self-Service And AI-Assisted Analysis
Assess natural-language questions, copilots, search, suggestions, narratives, anomaly detection, forecasting and user-created reports. Require clear semantic grounding, permissions, source visibility and controls that prevent plausible but incorrect conclusions.
Comparison Criterion
Security, Privacy And Data Access
Review identity, single sign-on, row and object security, data masking, administrator separation, guest access, sharing, exports, audit, regions and encryption. Map personal and commercially sensitive data to a justified audience rather than copying entire source systems.
Comparison Criterion
Performance, Capacity And Deployment
Compare cloud, self-managed and hybrid deployment, capacity, concurrency, query caching, extracts, direct query, high availability, development and test environments, release pipelines and monitoring. Test representative models and user loads.
Comparison Criterion
Embedding, Integration And Administration
Review APIs, SDKs, white labelling, portal embedding, write-back, workflow integration, marketplace extensions, metadata export, backup, tenant settings and service administration. Confirm development ownership, change control and product limits.
Measures To Define Before A BI Contract Is Signed
Translate trusted, real-time and self-service into measurable freshness, consistency, performance, adoption and decision outcomes.
| Measure | What It Should Define | Evidence To Request | Common Weakness |
|---|---|---|---|
| Data freshness | How closely the displayed information meets the approved refresh requirement for each decision | Source timestamp, extraction, transformation, model refresh, report timestamp, failure and owner | A dashboard displays today’s date while some underlying sources are several days old |
| Data-quality exception rate | The volume and age of records failing agreed completeness, validity, uniqueness or reconciliation rules | Rule, source, failed records, impact, owner, correction, repeat cause and accepted exception | Analysts correct data privately before reporting and the source problem remains invisible |
| KPI-definition consistency | Whether reports use one approved definition for the same business measure | Metric owner, formula, grain, exclusions, certification, reports using it and change history | Different departments use the same KPI name for different calculations |
| Report adoption | Whether intended users access, understand and act on governed reports | Active viewers, repeat use, role coverage, subscriptions, support demand and retirement candidates | High licence counts are treated as adoption even when reports are rarely opened |
| Query and page performance | How quickly representative reports load, filter and drill under expected concurrency | Model size, query duration, page load, percentile, concurrency, cache and capacity evidence | A small demonstration dataset hides slow production models |
| Self-service reuse | Whether business users build on certified data rather than recreating source extraction and metrics | Certified model usage, personal models, duplicated sources, unsupported reports and consolidation actions | Self-service increases the number of inconsistent datasets and support requests |
| Security and sharing exceptions | Whether access, exports and external sharing remain authorised and current | Role assignments, row-level access, guest users, public links, exports, exceptions and reviews | A report is secured but its exported spreadsheet is distributed without equivalent control |
| Refresh and pipeline reliability | Whether scheduled ingestion, transformation and model processes complete within the required window | Run success, duration, retries, failed dependencies, missed service time and cause | A failed overnight refresh is discovered only when a manager challenges the numbers |
| Decision and action impact | Whether analytics changes a defined operational or commercial outcome | Decision, baseline, report or alert, action owner, result, unintended effect and review | Dashboard delivery is counted as value without evidence that decisions changed |
| Total cost per active user | The complete platform, capacity, implementation, support and administration cost for users who rely on governed analytics | Licences, capacity, data services, partner cost, internal effort, active use and growth | Low viewer pricing hides expensive creator, capacity and data-engineering requirements |
Business Intelligence And Analytics Platforms UK Businesses Can Consider
Shortlist platforms whose modelling, user experience, governance and commercial model fit the data estate. Confirm current editions, regional availability and pricing directly before award.
Provider Profile
Microsoft Power BI
Microsoft’s self-service and enterprise BI platform connects, models, visualises and shares data across desktop, cloud, mobile and embedded scenarios, with close alignment to Microsoft Fabric and Microsoft 365. Include Power BI where Excel, Azure, Teams, SharePoint, Dynamics or Fabric are central. Confirm Pro, Premium Per User or Fabric capacity, creator and viewer rights, gateway design, semantic models, deployment pipelines, embedded use, Copilot eligibility and tenant governance.
Review official Power BI informationProvider Profile
Tableau
Visual analytics platform offering Tableau Cloud for hosted analytics and Tableau Server for self-managed deployment, with Desktop, Prep, Pulse and wider Salesforce integration. Include Tableau where rich visual exploration, analyst-led discovery and cross-platform data access matter. Confirm Creator, Explorer and Viewer roles, Cloud or Server architecture, capacity, data preparation, Salesforce integration, embedded analytics, AI features, migration, administration and total creator-to-viewer mix.
Review official Tableau productsProvider Profile
Qlik Cloud Analytics
Cloud analytics platform built around Qlik’s associative analytics engine, dashboards, self-service analysis, data preparation, alerts and newer agentic capabilities. Include Qlik where interactive exploration across multiple data sources and a governed cloud analytics environment are priorities. Confirm Qlik Cloud region, capacity, user entitlements, reloads, direct query, data integration products, alerting, embedded use, migration from client-managed Qlik Sense and partner support.
Review official Qlik Cloud Analytics informationProvider Profile
Google Cloud Looker
Enterprise business intelligence and embedded analytics platform using a governed semantic model to define reusable metrics and data access. Include Looker where Google Cloud, BigQuery, embedded data products or central metric governance are important. Confirm Looker or Looker Studio scope, platform edition, developer and standard users, LookML skills, data warehouse costs, conversational analytics, embedding, model governance and implementation partner capability.
Review official Looker informationProvider Profile
Domo
Cloud-native business intelligence platform combining data connection, preparation, visualisation, collaboration, applications and AI-assisted analytics. Include Domo where a business wants one managed cloud environment across mixed data sources and mobile or operational use. Confirm connector and data-refresh requirements, credit or consumption model, user roles, data storage, governance, application development, AI features, support and the total cost of data processing and user adoption.
Review official Domo BI informationProvider Profile
ThoughtSpot
Search- and AI-driven analytics platform designed for natural-language exploration, automated insights, semantic modelling, dashboards and embedded analytics. Include ThoughtSpot where broad business-user questioning and conversational analytics are priorities. Confirm underlying data-platform compatibility, semantic-layer design, user and consumption model, search accuracy, row-level security, embedded capabilities, AI governance, monitoring, implementation and the role of conventional dashboards.
Review official ThoughtSpot product informationProvider Profile
Sisense
Analytics platform focused strongly on embedding governed dashboards, conversational analytics and data experiences inside products and workflows through low-code, no-code and developer SDK approaches. Include Sisense where customer-facing or white-labelled embedded analytics is central. Confirm SaaS, dedicated-cloud or self-managed options, tenancy, developer tools, data model, white labelling, AI features, capacity, service levels, support and integration with the host application’s identity and billing model.
Review official Sisense platform informationProvider Profile
Zoho Analytics
Self-service BI and data analytics platform with cloud and on-premises options, broad application connectors, data preparation, dashboards, AI-assisted analysis and embedded capabilities. Include Zoho Analytics where an SME wants accessible pricing, rapid SaaS connections and a lower-administration route. Confirm row limits, users, viewers, workspaces, refresh frequency, connectors, data blending, white labelling, on-premises requirements, support and whether larger semantic or governance needs exceed the selected edition.
Review official Zoho Analytics informationWhat Changes Business Intelligence Software Cost
The viewer price is only one component. Creator licences, capacity, data engineering, warehouse use, implementation and ongoing governance can dominate total cost.
| Cost Driver | Why It Changes Spend | What A Comparable Proposal Should Show |
|---|---|---|
| Creator, analyst and viewer licences | Platforms distinguish report creators, model developers, explorers, viewers, guests and application users | Role list, named and occasional users, minimums, licence rights, inactive users and three-year growth |
| Capacity and compute | Larger models, concurrency, frequent refresh, AI features and embedded workloads may require dedicated or consumption-based capacity | Dataset sizes, query volume, refresh, concurrency, peak load, capacity unit, headroom and overage |
| Data volume and storage | Extracted data, retained history, in-platform storage, row limits and high-frequency data can change platform or warehouse cost | Source volume, growth, retention, compression, extracts, direct query, warehouse usage and archive |
| Data preparation and engineering | Connectors, transformation, quality, orchestration, gateways and semantic modelling require tools and specialist work | Sources, pipelines, models, reusable measures, quality controls, refresh windows and owner |
| Deployment and environments | Development, test, production, self-managed servers, gateways, private networking and disaster recovery add infrastructure or licences | Architecture, environments, region, network, availability, backup, monitoring and support responsibility |
| Embedded analytics | External users, white labelling, SDKs, capacity, tenancy and application integration often use separate commercial models | Audience, authentication, tenants, sessions, capacity, branding, development, support and service level |
| AI and advanced analytics | Conversational queries, forecasting, notebooks, machine learning and AI assistants may require premium tiers or additional cloud consumption | Use cases, eligible licences, model, semantic grounding, consumption, review and fallback |
| Implementation and migration | Source discovery, model design, dashboard rebuilding, validation, security and user training create significant one-off cost | Discovery, migration, build, testing, reconciliation, acceptance, documentation and customer tasks |
| Support, governance and administration | Platform administration, capacity monitoring, content certification, access reviews and user support continue after launch | Service hours, platform owner, change allowance, report support, release review and optimisation |
| Contract change and exit | Capacity reduction, content export, semantic models, source logic, embedded code and data transfer affect switching | Ownership, export formats, source files, APIs, notice, transition assistance and deletion process |
How The Data Estate Changes The Shortlist
The right platform depends on data architecture, user roles, reporting maturity, embedded requirements and the organisation’s ability to own metrics.
Microsoft-Centred SME
Prioritise Power BI, Excel familiarity, Microsoft identity, Teams and SharePoint distribution, Fabric roadmap, gateway design, role-based licensing and governance that prevents uncontrolled personal models.
Cross-Department Management Reporting
Prioritise certified KPIs, semantic models, scheduled reporting, comments, row-level access, drill-through, data-quality ownership and a controlled route from spreadsheets to repeatable management packs.
Product Or Customer-Facing Analytics
Prioritise embedded authentication, multi-tenancy, white labelling, SDKs, performance, capacity, product analytics, support boundaries and a commercial model that remains viable as external usage grows.
Data-Mature Enterprise
Prioritise warehouse integration, reusable semantic layers, development and test environments, lineage, catalogues, capacity monitoring, self-service governance, AI controls and a scalable operating model.
How To Compare BI Proposals
Give every provider the same source systems, data volumes, refresh targets, KPI definitions, user roles, security rules, reports, embedded requirements, peak usage and support assumptions. Require each response to show how data reaches the report and who owns every transformation and metric.
- Every dashboard measure maps to an approved definition and owner
- Sources, gateways, transformations and refresh failures are demonstrated
- Creator, explorer, viewer and capacity assumptions are normalised
- Row-level access, export and guest scenarios are tested
- Performance uses representative production data and concurrency
- Models, reports, code and documentation are covered at exit
Make Every Provider Reconcile The Same Numbers
Give each finalist the same duplicated customer, late transaction, revised target, restricted employee record and changed product hierarchy.
Compare data-quality handling, metric consistency, access control and explanation before comparing the visual design.
Six Questions To Put To Every Analytics Provider
The answers expose inconsistent metrics, hidden capacity, weak security and difficult platform transfer before the agreement starts.
How Will You Create One Trusted KPI Definition?
Ask the provider to demonstrate reusable metrics, ownership, documentation, certification, change history and every report that depends on the definition.
How Will Data Reach The Dashboard Reliably?
Confirm connectors, gateways, extraction, transformation, data-quality checks, incremental refresh, schedules, retries, monitoring and source-system impact.
Which Licences And Capacity Are Required?
Map creators, developers, explorers, viewers, guests, external users, refresh, model sizes, concurrency, AI and embedded use to named commercial units.
How Are Access, Sharing And Exports Controlled?
Demonstrate identity, row and object security, administrator roles, guest access, subscriptions, exports, public links, audit and periodic review.
What Happens When A Source Or KPI Changes?
Confirm lineage, impact analysis, development and test, regression, owner approval, release, rollback, communication and historical comparability.
What Can We Transfer At Exit?
Confirm report and model files, transformation logic, semantic definitions, source code, APIs, embedded components, documentation, assistance and data deletion.
A Seven-Stage Business Intelligence Platform Evaluation
Move from business questions and governed metrics to controlled production analytics rather than purchasing dashboard licences before fixing the reporting model.
- Inventory reports, spreadsheets, data sources, owners, users, KPIs, refresh frequency, manual work, recurring disagreements and unsupported reporting.
- Define the decisions, audiences, metric owners, data grain, freshness, security, distribution and service requirements before selecting visuals.
- Design the target data flow from source through preparation, quality, semantic model, report, distribution, monitoring and retention.
- Issue one written brief and obtain comparable platform, capacity, implementation, migration, governance, support and three-year commercial responses.
- Run a production-like pilot using representative data volumes, flawed records, restricted users, KPI changes, refresh failures and peak concurrency.
- Deploy in controlled releases with development and test, reconciliation, user acceptance, training, access review, rollback and retirement of replaced reports.
- Operate through KPI governance, content certification, data-quality review, capacity monitoring, adoption measures, release testing and report retirement.
Business Intelligence / Analytics Platform Comparison Checklist
Use this table before approving a BI platform, implementation programme or managed analytics service.
| No. | Requirement | Evidence To Obtain Before Award | Confirmed |
|---|---|---|---|
| 01 | Business questions, decisions and owner agreed | Audience, decision, frequency, action, accountable owner, baseline and expected value | |
| 02 | Report and source inventory completed | Reports, spreadsheets, systems, files, APIs, owners, refresh, duplication and retirement candidates | |
| 03 | KPI definitions and grain approved | Formula, source, dimensions, time basis, exclusions, owner, certification and change process | |
| 04 | Data preparation and quality controls designed | Transformation, validation, reconciliation, exceptions, lineage, issue ownership and evidence | |
| 05 | Semantic model demonstrated | Relationships, measures, hierarchies, reusable dimensions, calendars, documentation and reuse | |
| 06 | Security and privacy model tested | Identity, row and object access, guests, exports, audit, personal data, minimisation and DPIA decision | |
| 07 | Refresh and gateway design accepted | Extraction, schedule, incremental load, on-premises gateway, retries, monitoring and failure notification | |
| 08 | Performance and capacity validated | Model size, query, page load, concurrency, peak usage, cache, capacity and growth | |
| 09 | Creator and viewer roles agreed | Developers, analysts, self-service users, viewers, external users, administrators and training | |
| 10 | AI and natural-language features governed | Semantic grounding, eligible data, permissions, source visibility, review, usage and fallback | |
| 11 | Development, test and release process approved | Environments, source control, deployment, regression, approval, rollback and communication | |
| 12 | Embedded and distribution requirements demonstrated | Portal, SDK, authentication, multi-tenancy, subscriptions, mobile, exports and accessibility | |
| 13 | Implementation and migration scoped | Models, reports, data, validation, training, support, documentation, customer tasks and exclusions | |
| 14 | Three-year total cost compared | Licences, capacity, warehouse, gateways, implementation, support, administration and growth | |
| 15 | Ownership, transfer and retirement agreed | Reports, models, transformations, source files, code, APIs, documentation, notice and deletion |
Common Business Intelligence Platform Buying Mistakes
Most avoidable problems begin with dashboard-first selection, unowned measures or a cost comparison that excludes data engineering and capacity.
| Mistake | Why It Creates Risk | Better Control |
|---|---|---|
| Choosing the prettiest dashboard demonstration | Visual quality hides weak modelling, refresh, security and operational support | Test the full data path and failure cases |
| Rebuilding accounting or CRM reports only | The platform remains tied to one source and does not solve cross-business analysis | Prioritise governed cross-system questions |
| Starting without KPI owners | Departments recreate competing definitions and distrust the platform | Assign business ownership before report development |
| Loading every available data field | Unnecessary data increases cost, complexity and privacy exposure | Use purpose-led minimisation and documented access |
| Giving everyone unrestricted self-service | Duplicate models and unsupported measures multiply quickly | Use certified datasets, roles, training and review |
| Testing on sample data only | Production model size and concurrency cause slow or failed reports | Test representative volume, refresh and users |
| Ignoring exports and subscriptions | Controlled dashboards produce uncontrolled spreadsheets and email attachments | Apply governance to every delivery channel |
| Buying AI before semantic governance | Natural-language answers use ambiguous metrics and appear more certain than the data allows | Ground AI in approved models and permissions |
| Keeping every report indefinitely | Users cannot identify trusted content and support effort increases | Measure adoption and retire obsolete reports |
| Deferring platform exit and ownership | Models, calculations and embedded code become difficult to transfer | Secure export, source and documentation rights before award |
Frequently Asked Questions
Answers to common questions from UK businesses comparing dashboard, self-service and embedded analytics platforms.
What Is Business Intelligence Software?
Business intelligence software connects, prepares, models and presents data so organisations can monitor performance, explore causes and make repeatable decisions. It may provide dashboards, reports, alerts, semantic models, scheduled distribution, natural-language analysis and embedded analytics.
How Is Business Intelligence Different From Accounting Software?
Accounting software records financial transactions and produces finance-led reports from its own data. A BI platform can combine finance with sales, service, operations, workforce and other sources. This page compares cross-system analytics rather than accounting-only reporting.
How Is Business Intelligence Different From CRM Reporting?
CRM reporting focuses on leads, opportunities, customers and activities held in the CRM. Business intelligence can combine CRM information with finance, product, support, marketing and operational data under shared definitions. CRM-only products are outside this page's provider comparison.
Does A Small UK Business Need A BI Platform?
A small business may benefit when recurring reports require manual spreadsheet work, teams dispute KPI definitions, data sits across several applications or managers cannot see performance quickly. The selected platform should remain proportionate to the data volume, users and available administration.
What Is A Semantic Model In Business Intelligence?
A semantic model organises data into business-friendly measures, dimensions, relationships and rules. It can define metrics such as revenue, margin or active customer once and reuse them across reports. Strong governance reduces inconsistent calculations while preserving authorised analysis.
What Is Self-Service Analytics?
Self-service analytics allows authorised business users to explore governed data and create reports without relying on a central analyst for every question. It works best with certified models, training, role-based access, content ownership and a process for reviewing duplicated or unsupported reports.
How Often Should BI Dashboards Refresh?
Refresh frequency should match the decision. Board reporting may need daily or monthly data, while operational monitoring may require hourly or near-real-time updates. Faster refresh increases source, gateway, capacity and support requirements, so the business should define freshness by use case.
How Much Does Business Intelligence Software Cost?
Cost may include creators, analysts, viewers, capacity, storage, gateways, data warehouses, preparation, implementation, support, training and administration. Compare a three-year total using real data volume, concurrency, refresh and embedded requirements rather than only the advertised viewer price.
Can AI Replace BI Analysts?
AI can help users ask questions, create visuals and explain trends, but it still depends on accurate data, approved metrics, permissions and review. Analysts and data owners remain important for model design, quality, interpretation, governance and decisions with material consequences.
How Should A UK Business Compare BI Platforms?
Give every provider the same sources, volumes, refresh targets, KPI definitions, users, security, reports and embedded requirements. Compare configured models, reconciliation, performance, required licences, implementation, governance, three-year cost and exit—not only dashboard appearance.
Provider Information And UK Analytics-Governance Resources
Reviewed by Bhav Giva, Founder & Lead Analyst at CompareServices.co.uk, on 16 July 2026.
Use official provider documentation to confirm current editions, capacities, regions, AI features, embedded options, support and contractual terms. Analytics platforms and commercial models can change during a procurement cycle.
- ICO — Data Protection Impact Assessments
- ICO — Data Minimisation
- NCSC — Using SaaS Securely
- NCSC — Logging For Security Purposes
- Microsoft — Power BI
- Tableau — Analytics Products
- Qlik — Cloud Analytics
- Google Cloud — Looker
- Domo — Business Intelligence
- ThoughtSpot — Analytics Platform
- Sisense — Analytics Platform
- Zoho — Analytics